Dashboard
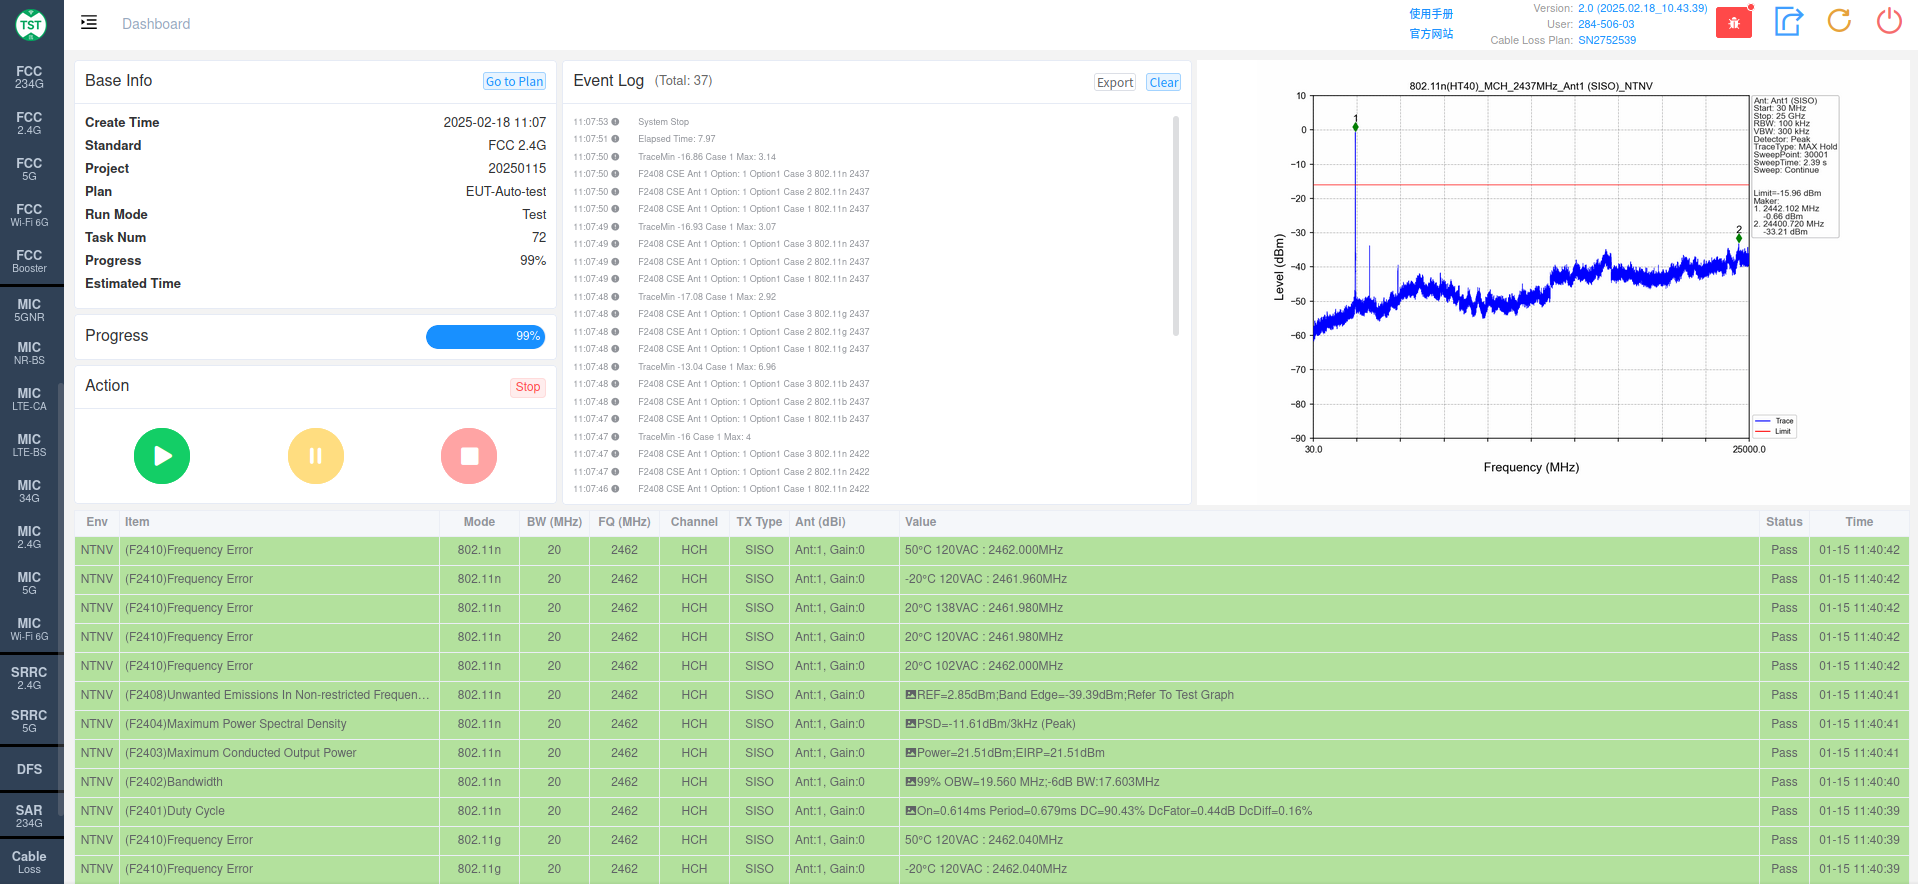
As the interactive window during the testing process, the dashboard is the most frequently used page.
The TST PASS dashboard is divided into 6 areas (Area 1 ~ Area 6).
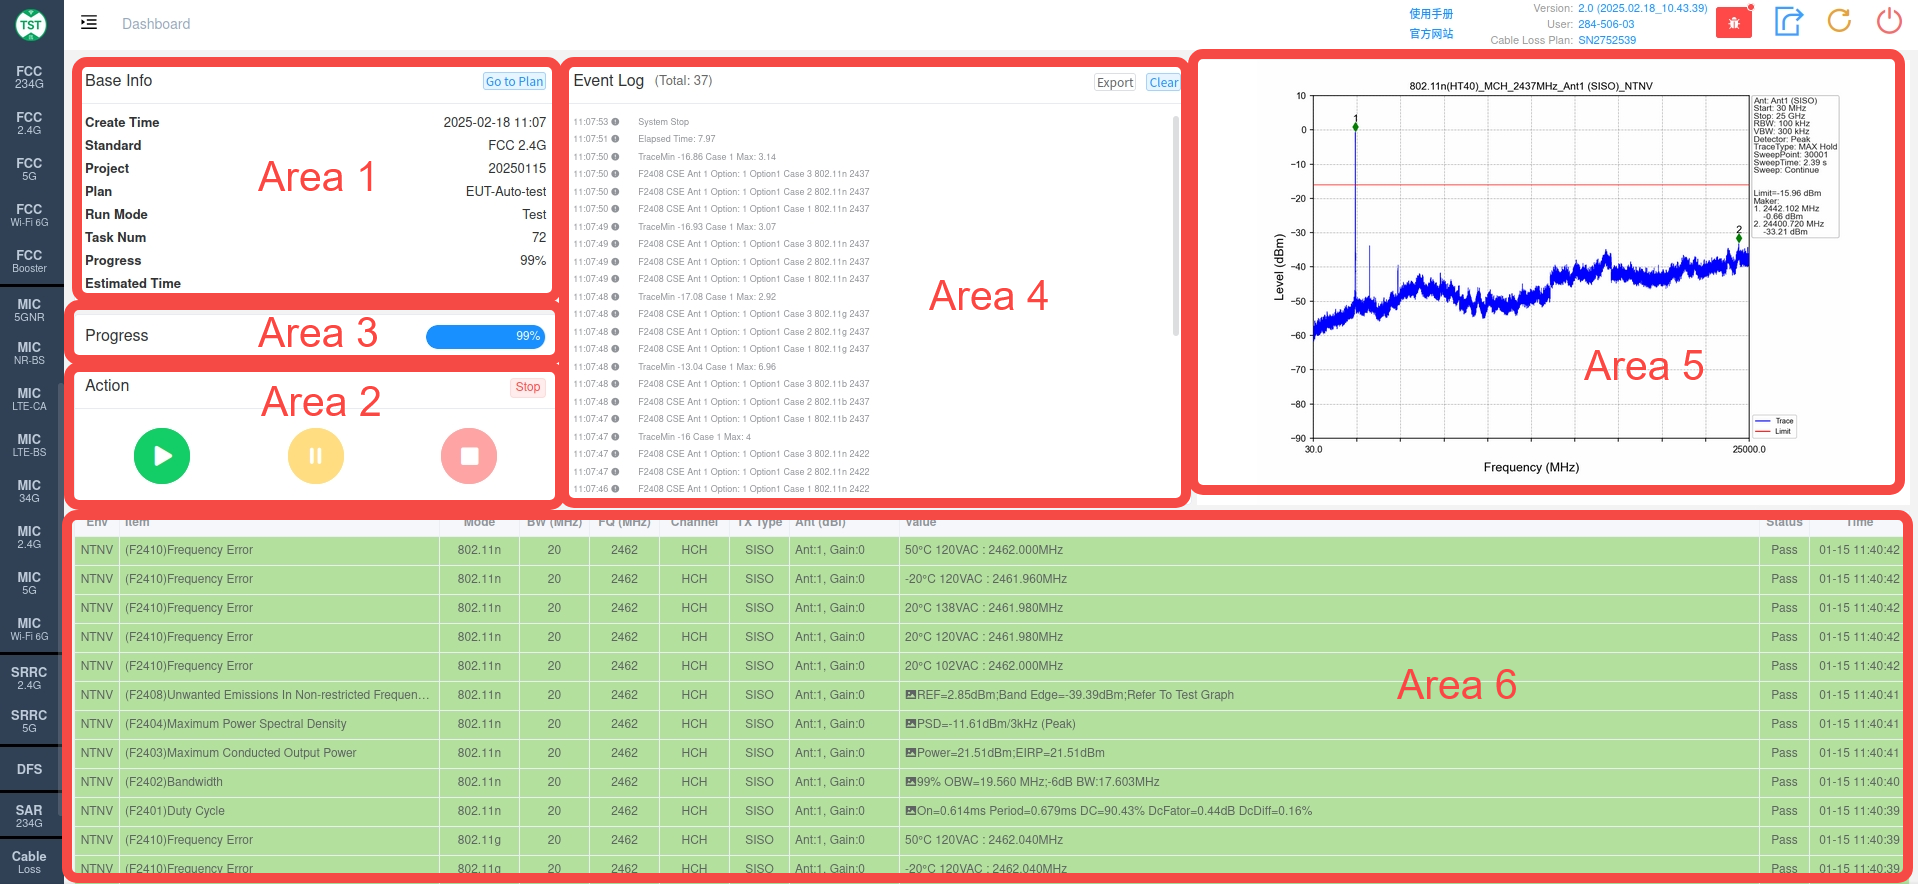
Area 1: Displays basic information about the current test task.
Area 2: Start, Pause, and End buttons.
Area 3: Test progress.
Area 4: Log information during the testing process.
Area 5: Test result graph display window, real-time display of the latest test graph. Clicking on the image will enlarge it to the center of the window.
Area 6: Specific information and status (Pass, Fail, Warning) of the test results.